References
2011年11月11日星期五
EXP2 Final Submission: RESEARCH
References
Add Child to an XML file http://benv2423rui.blogspot.com/2011/10/add-child-to-xml-file.html
EXP2 mod file download link
http://www.gamefront.com/files/20983839/Yaqi_z3326661_EXP2.zip
http://www.gamefront.com/files/20979156/z3326661_Objects.zip
http://www.gamefront.com/files/20979156/z3326661_Objects.zip
2011年11月8日星期二

2011年11月7日星期一


EXP2_Week 4 short video of analysing data
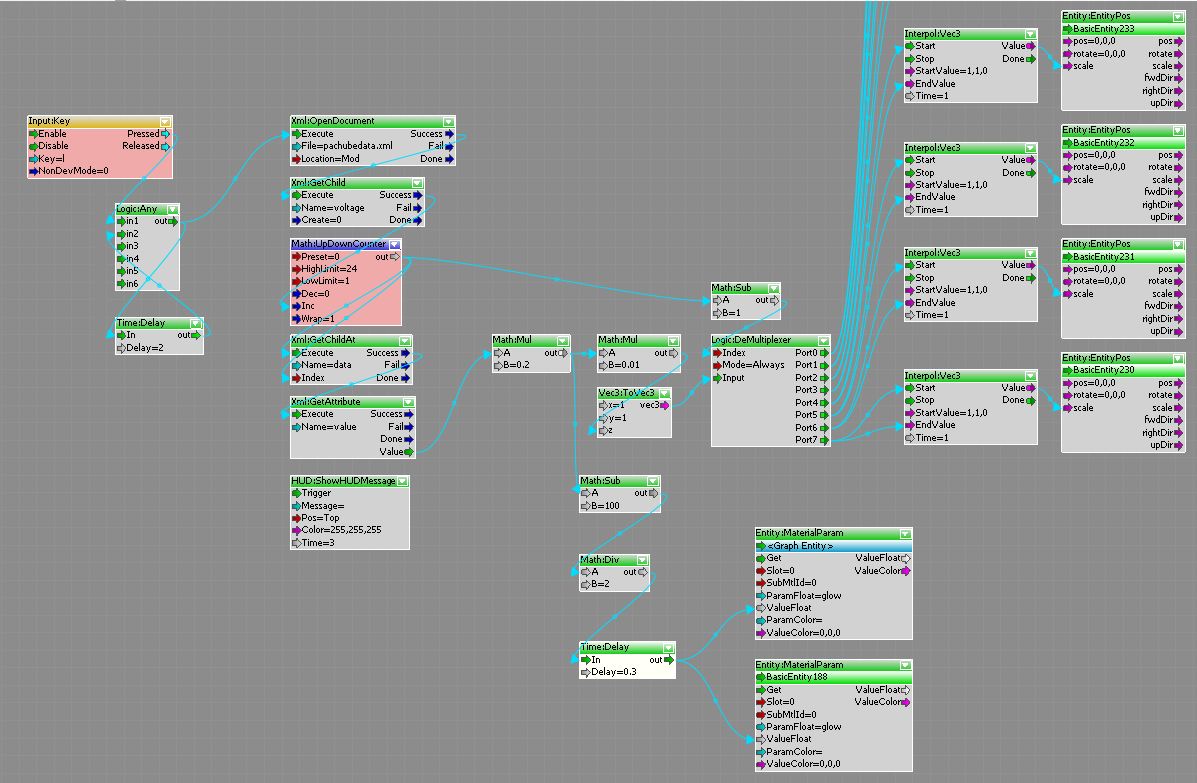
The data from the feed is actually an AD value of the voltage. normally the data is around 40, but when a user cover a LED the the output data of that LED will be aroung 1000. There is a big gap between the false value(no user cover a LED) and the true value(user cover a led then the LED lighting itself). Therefore, I created this flow graph, I have size down the data to make sure they can be observed clearly, and then test if the data is below the true value range, if below then turn of the lighting box whereas if the data is above the true value range then turn the light on.
2011年11月4日星期五
EXP2_Week 2-Analytics Engine brief
Precedent study:
my chosen pachube is Use LED as both the sensor and light emitter. LEDs are commonly used as lights, but then can also be used as photodiodes to detect light. It can be achieve by using a high resistance circuit to charge up and release electric capacitance of LED to sample the ambient light level and then glow at an appropriate brightness. The data from feed is out put voltage AD value, but the meaning and usage of data is doing nothing with voltage.
Analytics Engine brief
In the real world situation, when user get close to the LED and cover it there will be light reflect back to the LED and a large value data will be generated. there for I’d like to use the distance in between the player and a react model to indicate the amount of reflected light. In my analytic engine I'm going to rebuild the real situation and use this week's tutorial flowgraph to generate xml file about the distance, then use the generated xml file to build a column diagram, so viewer will be easily understand what the pachube data means.
The data from my chosen feed is as low around 50 or as high around 1000, but in between there is very rare data appears. The data has a very wide range with a really big gap in it. Actually, the data can be regard as a true or false statement. the large value data generated when a user close to the LED which is as TRUE and the small data indicate that there is no user trigger the LED which is as FALSE. So I planning to make something can represent this true and false statement.
Data from the feed is also in related to time, the longer the user cover a LED the longer the output data of that LED will keep large (or true). I will use spawn for this case, model will generate follow by the player and the longer the player stay in one place the model will get larger.


2011年11月3日星期四
EXP2_Week 1-Pachube feed
LEDs double as sensor and light emitter
https://pachube.com/feeds/37411
https://pachube.com/feeds/37411


Feed description:
The project is Using LED as both light emmiter and light sensor. When LED as a sensor, the voltage of the LED will be change while it receiving the reflected light. The feed shows the output data from the arduino digitalport that is actually the voltage of the Led, we can detect if there is light reflect back to LED by sensing the output voltage.
S.W.O.T analysis
Strengths: Using LEDs as light source is really an energy saving idea. And it is more interesting that the LEDs in themselves are sensors. Other than using temperature sensor or infrared sensor, Leds can interact with user just by itself. compare to normal sensors that just get information from the user, the LEDs emit light only a very short time but in high frequency which can be regard as giving information to the user and then sensing if any information sent back.
Weeknesses: The data is as low around 50 or as high around 1000, but in between there is very rare data appears. The data has a very wide range with a really big gap in it.
Opportunities : make LED as both sensor and light emitter can be used to build interactive panel or interactive wall. It is low energy light source when there is no ristrict of light intensity and it is a creative way in decoration.
Threats: It might be affected by other light which contains same spectrum as the LED, this makes the LEDs hardly to know if there is an user cover the light or just other light sources affection.
EXP2_Week 1-Average velocity
This is a short video showing the analysis of the average velocity of the moving can
2011年9月12日星期一
订阅:
评论 (Atom)