References
2011年11月11日星期五
EXP2 Final Submission: RESEARCH
References
Add Child to an XML file http://benv2423rui.blogspot.com/2011/10/add-child-to-xml-file.html
EXP2 mod file download link
http://www.gamefront.com/files/20983839/Yaqi_z3326661_EXP2.zip
http://www.gamefront.com/files/20979156/z3326661_Objects.zip
http://www.gamefront.com/files/20979156/z3326661_Objects.zip
2011年11月8日星期二

2011年11月7日星期一


EXP2_Week 4 short video of analysing data
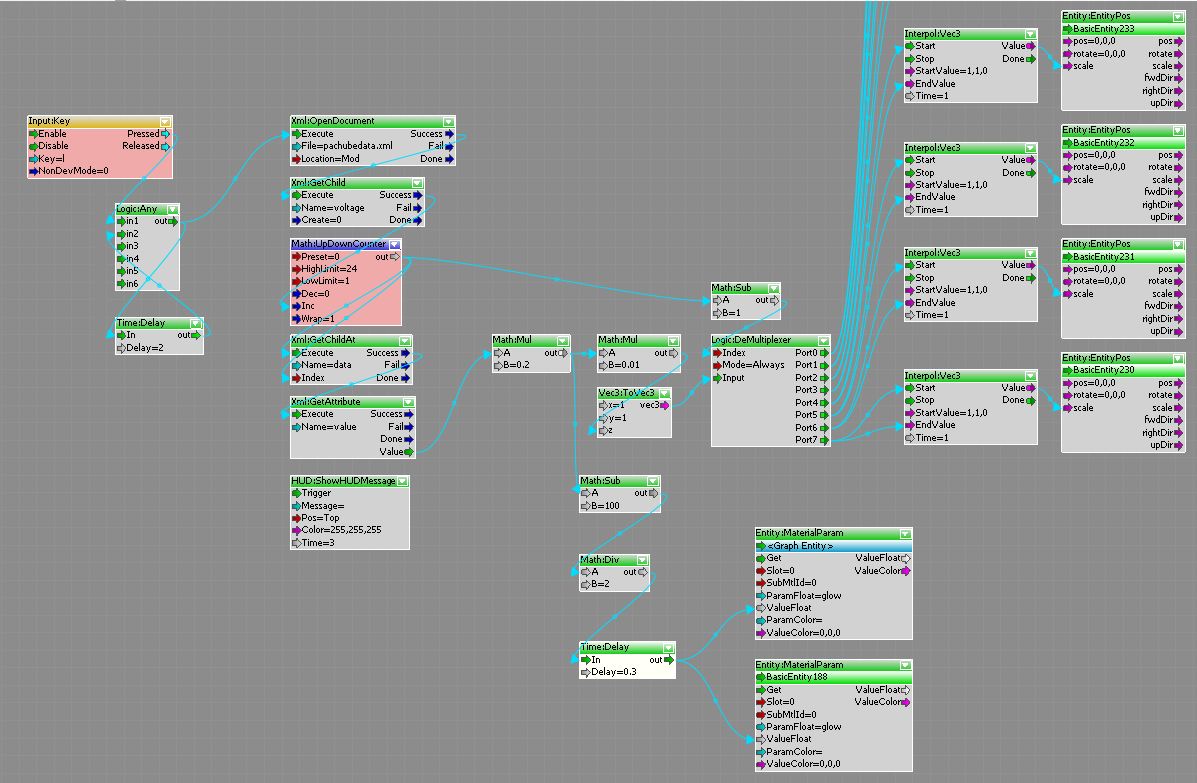
The data from the feed is actually an AD value of the voltage. normally the data is around 40, but when a user cover a LED the the output data of that LED will be aroung 1000. There is a big gap between the false value(no user cover a LED) and the true value(user cover a led then the LED lighting itself). Therefore, I created this flow graph, I have size down the data to make sure they can be observed clearly, and then test if the data is below the true value range, if below then turn of the lighting box whereas if the data is above the true value range then turn the light on.
订阅:
博文 (Atom)